| Author |
Message |
    
Bsilliman
| | Posted on Monday, July 14, 2008 - 09:27 am: | 


|
im looking for a dyno tuning shop in the virginia beach virginia area? so far closest place is ray price out of raliegh north carolina which is 200 miles from here? anyone know of anyplace closer? |
Odinbueller
| | Posted on Monday, July 21, 2008 - 01:26 pm: |
|
Well, we're probably farther away that 200 miles, but we are...
- Partnered with TechnoResearch for DirectLink tuning.
- Fully trained by Dynojet Research on our 250i dyno.
- Sneezing distance from New Jersey Transit on the North East Corridor line if you want to go into NYC (think of it as a vacation)
- Multiple hotels in our area (thusly reinforcing the vacation aspect)
- And these...
If you're interested, feel free to contact Tim, Vinny, or Anthony at the service desk for an appointment, and you can contact me for accommodations if you want to stay over for a night or two 
Chris |
Lanretsr
| | Posted on Monday, August 25, 2008 - 01:52 am: |
|
What town in NJ are you. I'm interested in getting some dyno time over the winter after some mods and was looking for an buell experienced dyno near Ct. |
Packrat
| | Posted on Monday, August 25, 2008 - 08:59 am: |
|
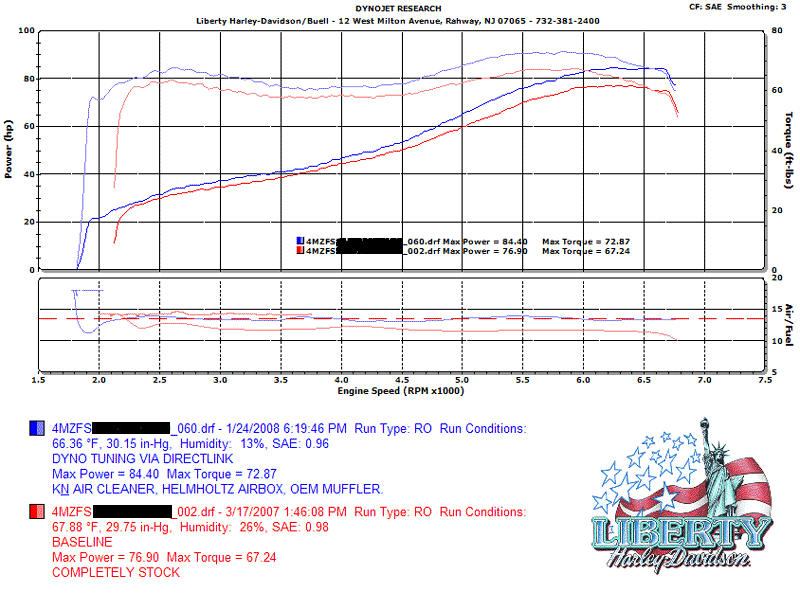
Maybe it's at the address printed along the top of each of the dyno charts shown??? |
Lanretsr
| | Posted on Monday, August 25, 2008 - 11:30 am: |
|
I can't believe I didn't see that, Thanks |
Thunderbox
| | Posted on Friday, December 05, 2008 - 12:34 pm: |
|
Below 5252 rpm any engine's torque number will always be higher than its horsepower number, and above 5252 rpm any engine's horsepower number will always be higher than its torque number. At 5252 rpm the horsepower and torque numbers will be exactly the same.
There is something wrong with these dyno graphs because this isn't the case. If the HP and Tq do not cross at 5252 RPMs then the dyno was done incorrectly.
(Message edited by thunderbox on December 05, 2008) |
Buelltuner
| | Posted on Friday, December 05, 2008 - 06:25 pm: |
|
it's only because the scaling is not the same for torque and horsepower. i don't like looking at graphs this way either because it is impossible to compare. |
Bombardier
| | Posted on Saturday, December 06, 2008 - 05:18 pm: |
|
5252rpm
Can you explain this statement to me please as I am interested to know why this is so? |
Puddlepirate
| | Posted on Sunday, December 07, 2008 - 06:53 pm: |
|
It is the formula used to calculate HP.
(Torque x 5252) Divided By 5252 |
Bombardier
| | Posted on Sunday, December 07, 2008 - 09:32 pm: |
|
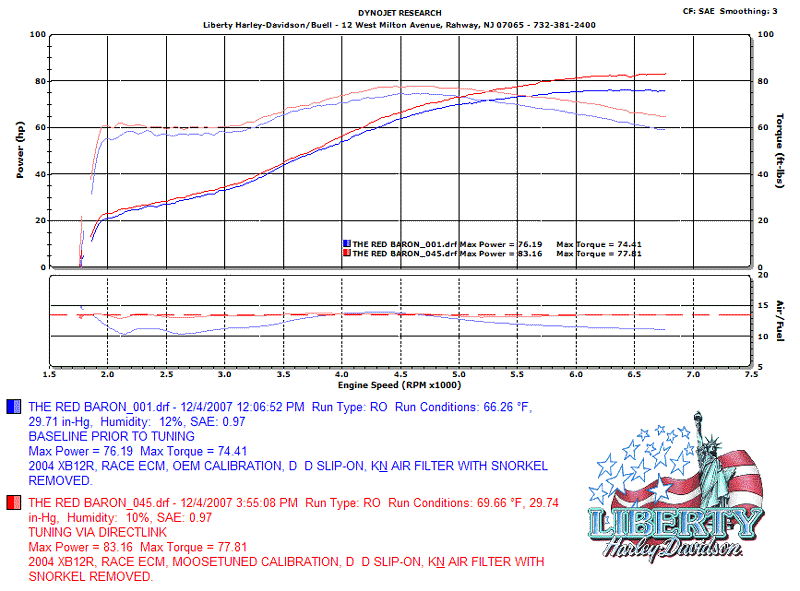
The third graph seems to be okay then. |
Blake
| | Posted on Monday, December 08, 2008 - 12:31 am: |
|
They are all okay. |
Puddlepirate
| | Posted on Monday, December 08, 2008 - 07:02 am: |
|
I agree with Blake and Buelltuner. Look at the numbers running up either side of the graph (the HP and TQ figures). If they were scaled together, ie same numbers on the same lines, then the lines should cross at 5252.
The figures are scaled, so the lines will not cross at 5252. There is nothing wrong with these graphs. |
Bombardier
| | Posted on Monday, December 08, 2008 - 03:49 pm: |
|
Why would you scale them differently then? |
Puddlepirate
| | Posted on Monday, December 08, 2008 - 06:51 pm: |
|
Hopefully someone else can chime in on this one. I'm just a mechanic, not a dyno tech.
I've never heard an explanation for it, although I am curious. |
Turk
| | Posted on Monday, December 08, 2008 - 07:26 pm: |
|
Just for visibility. If you're only making 60 ft-lbs of torque, you wouldn't want to look at it on a scale that goes to 200, it would make variations much less pronounced. |
Bombardier
| | Posted on Monday, December 08, 2008 - 09:35 pm: |
|
No I don't think that is right.
If you changed the scale equally that would make sense.
To change one and not the other seems to be a way to make the output look larger. |
Turk
| | Posted on Monday, December 08, 2008 - 09:43 pm: |
|
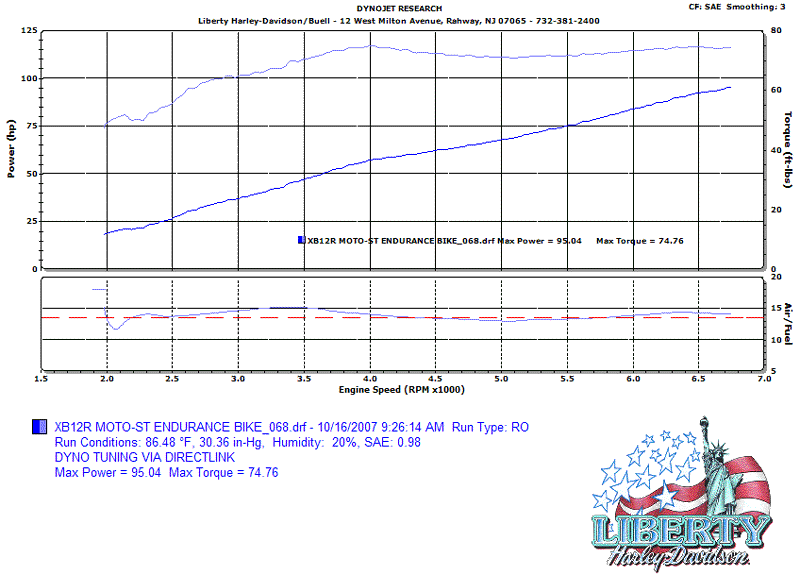
Look at the last chart - HP is 95 and torque is 74, that's almost a 30% difference so why would you scale them the same? Putting the torque on a different axis with a different scale allows you to better see what's going on. It's no different than Excel which does the same thing automatically when you switch one series onto another axis. It's really not anymore complicated than that. |
Xoptimizedrsx
| | Posted on Sunday, January 11, 2009 - 10:27 pm: |
|
for me looking at the afr. its not right on any of the runs. adjust the fuel maps. b ut to do so correctly run it separately on each cylinder. then you will see a big difference. shoot for the 13.2 range stable in open loop. if you need scale the closed loop lower in tps deg. as well as rpm. look at the dyno run then look at the fuel map. its there in the face the afr and fuel maps speek for them self. if you need get a pair of lc1 units and a dual guage. it will help you get the dyno run your bike will do best.
all ecms thats any ecm sold for a bike on the road has epa regulations it MUST HAVE. the track data and offroad data is something totally different. |
Buelltuner
| | Posted on Monday, January 12, 2009 - 05:26 pm: |
|
Turk, actually it does make that graph harder to read because the grid is scaled to only one set of numbers. This means that if I were to lay two or more runs over each other trying to see gains or losses, it would be harder to use the given horizontal lines for reference for HP and Torque. the last graph for example is pretty much divided 25 HP per line, but the torque doesn't fall on any given equal increment. A graph should show the most information with the least amount of effort. This thread is an example of what a confusing graph can do. |
Turk
| | Posted on Monday, January 12, 2009 - 09:37 pm: |
|
Yes, the grid is only scaled to one axis, again the same thing Excel does. But again, when torque and hp numbers are significantly different, you lose a lot of little dips that are there if you put it on the same axis. I may not be the best for laying two plots over top of each other, but it's the reason that the software does it. It's just a basic plotting software that works the same as any other. |
Buelltuner
| | Posted on Tuesday, January 13, 2009 - 12:02 pm: |
|
yeah yeah, it's just my anal retentive ways |
Buelltuner
| | Posted on Wednesday, January 14, 2009 - 11:39 am: |
|
puddlepirate, correction on the formula. It is (torque X RPM)/5252. If you multiplied then divided by 5252 your horsepower would be the same as torque at all RPM. |
Pammy
| | Posted on Saturday, January 17, 2009 - 10:22 am: |
|
If it is the same as it is around here...it just depends on who is printing the graphs. You choose to scale. The other is automatic. Nothing devious or planned. |
 »
Dyno tuning??
»
Dyno tuning??