| Author | Message | ||
Sifo |
I disagree that they are more useful. You can't tell anything by looking at the relative slopes, since slope changes visually by a factor of ten as you go up the chart. I does help expose what was happening at the lower ranges though. But as far as current trajectory, the simple X-Y plot seems much more intuitive and informative to me. See what you think: I think I couldn't disagree more strongly. Looking at the data this way, it's pretty much impossible to gauge when you will hit a mark, let's just say 100 deaths per million. Will that take days? Weeks? Months? You really can't tell by looking at the chart. To my eye, it looks like it might take at least a few months. What does it look like to you? 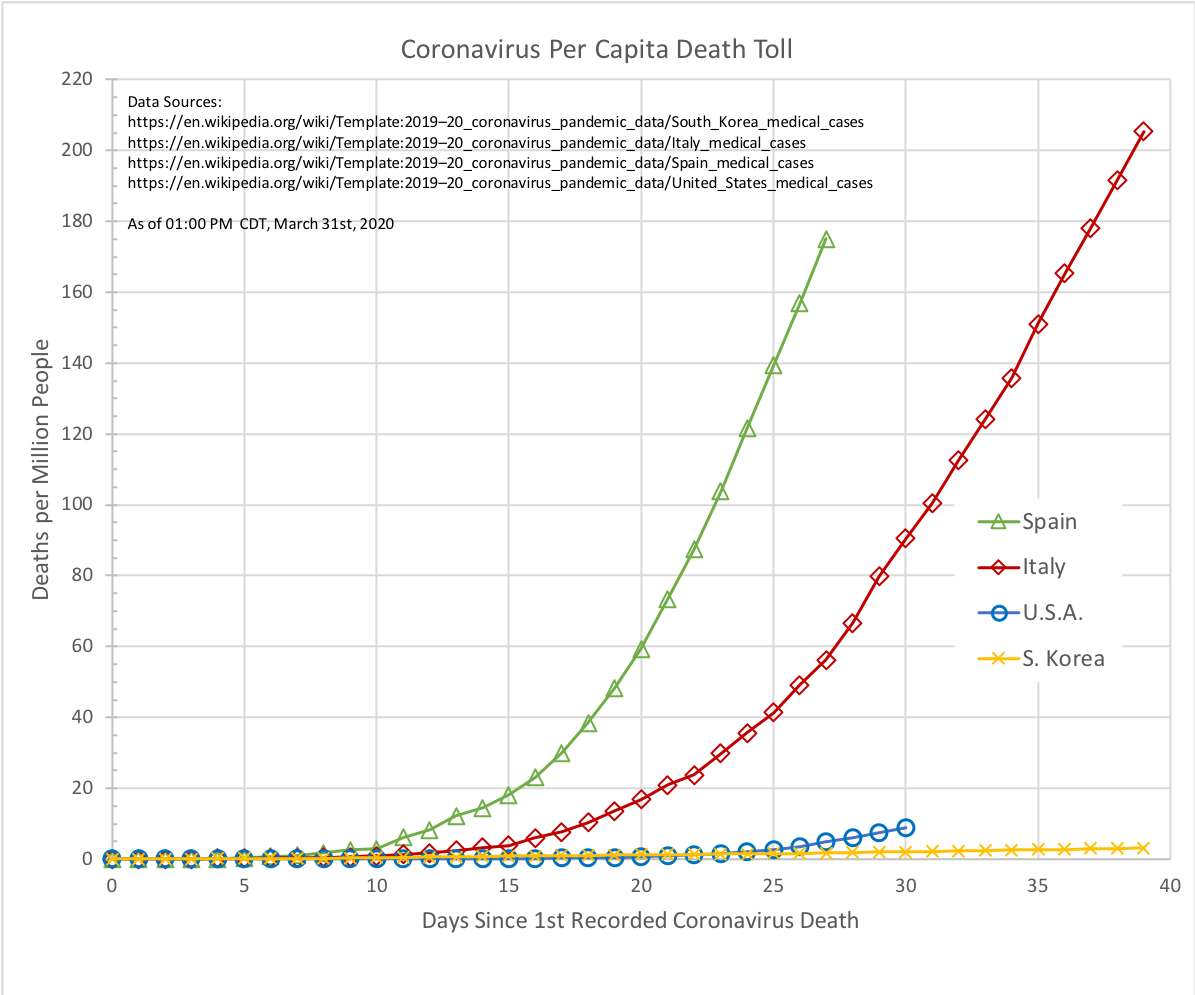 Looking at the same thing on a log chart it makes the trajectory very clear. It's easy to see that on the current trajectory we will probably hit the 100 per million mark about day 38, just 8 days away. BTW, those deaths are all ready infected. This is where the confirmed infected is useful. It will help predict how many hospital beds will be needed next week or month. The log chart makes it easy to see visually. 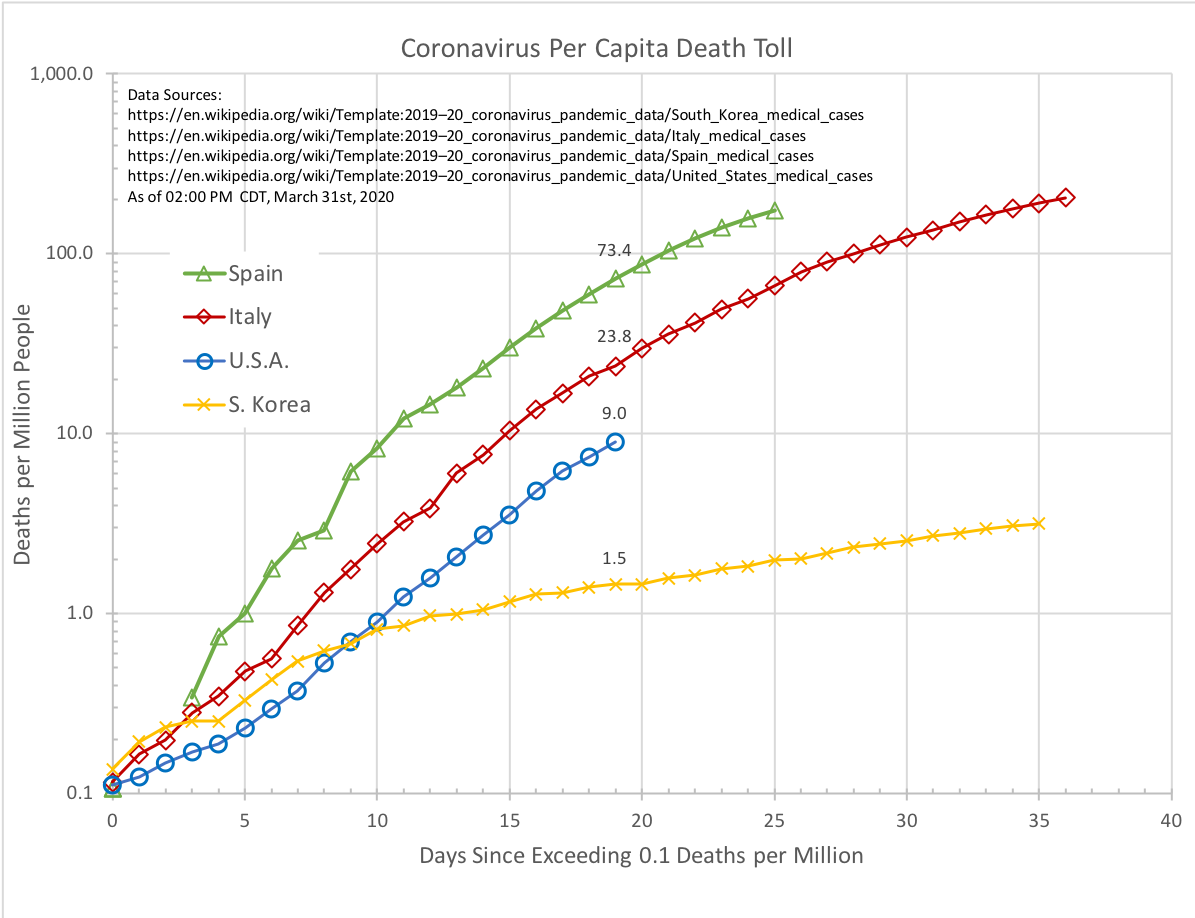 I was just watching the daily briefing while writing this, and Dr. Brix said they are looking at 100k to 200k deaths from this, with the interventions we are doing. Without interventions, they projected 1.5mm to 2.2mm (I think I have that right). EDIT: To fix graphic that didn't show up. (Message edited by Sifo on March 31, 2020) Tom, Is that the one you were after? (Message edited by blake on March 31, 2020) EDIT: This is what I was after... 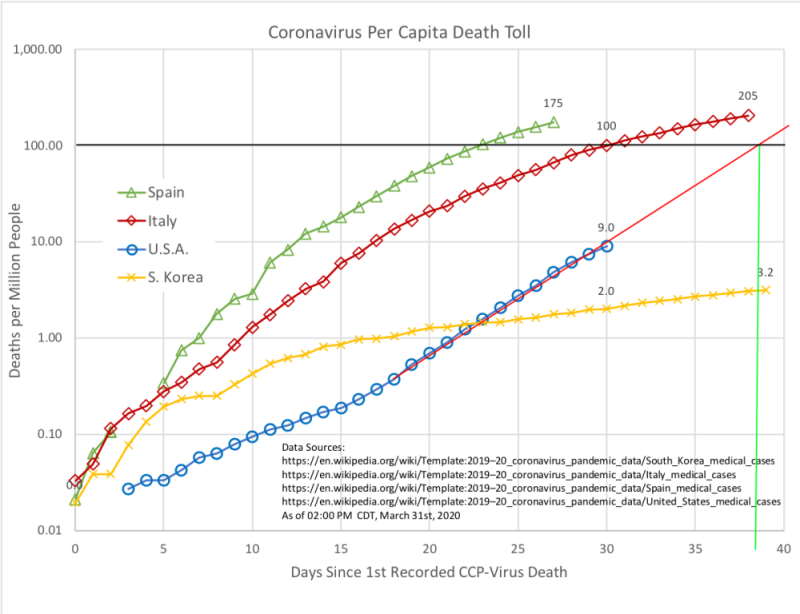 I hope! (Message edited by Sifo on March 31, 2020) | ||
Sifo |
Well, for some reason, the second chart didn't show up in that last post. I'll see if I can figure out what happened. It looked fine in the preview. | ||
Aesquire |
...they need to review their laws. Why? If the purpose of the law is to ensure jobs, as stated, what difference does the automatic shutoff handle make? Except to enable one worker to safely service multiple customers. It's an anecdote, possibly true, that an Oregon lawmaker's wife was incompetent or ignorant. Or it could be an old joke. It's a fact that lawmakers in a couple of states voted for this law on the basis of preserving jobs. It's a safe assumption they got campaign contributions to assist in that choice, but I assume the vast majority of laws passed are sponsored with bribes from interest groups. I'm not complaining! My Union spends a lot of my dues money on campaign contributions to try and keep Union jobs alive. I have an oft repeated complaint that they foolishly don't bribe both Parties more equally, like ADM or Exxon, to be sure that no matter who wins an election they get desired results, but that's a strategic disagreement, not a call to cease lobbying efforts. | ||
Aesquire |
Sifo, if, as seems to be the case, the first deaths in the U.S. were actually back in November or October, then the "days since first reported death" figure is way off. Gigo applies here. I'm not arguing for or against your predictions, just have the opinion that the predictions and numbers will change as we fill in the blanks of the past & update the graphs with new ( and old ) information. I'm still saying this is serious, that the media is hyping panic for both political and monetary gain, and that it's not going to end up as bad, or as good, as the extremes of spinning pundits say. But you can take the above paragraph and use it as canned boilerplate for most news. I don't deny it could be far worse than I think. I could be dead shortly! Millions could die! Dogs and cats, living together! | ||
Sifo |
Just a couple of corrections to the bit about the Whitehouse briefing. It's Dr. Birx and the are modeling 100k - 240k deaths with the interventions. | ||
1313 |
Just in case anybody wants some follow-up information... I'm just curious; does anybody here personally know anybody who has contracted the Corona Virus? I do. As with Hoot, a coworker of mine, thankfully far enough removed for me although others in my department had orders from the health department to self quarantine for a period of time. After the determination was made, they shuttered our building forcing those that work there to work from home, then a few days later they closed our entire site. I've been working from home since St. Patrick's Day. I thought what happened in Vegas was supposed to stay in Vegas... As of Monday (3/30): Coworker 1 "is no longer considered contagious and is recovered from COVID-19 and can go out in public if they choose to do so." Coworker 2 "and their family have no signs of the virus and their testing was negative." Comment today (3/31) from coworker 1: "I would like to thank you at this time for all the prayers and well wishes. Thank you to everyone that has reached out and helped my family throughout this difficult time we cannot thank you enough. I am feeling much better however I am not ready to go out into public as of yet I am too scared." Coworker 1 was back to work (from Vegas) 3/9, out sick beginning 3/11, confirmed positive 3/18. FWIW, YMMV and every other disclaimer you can throw at it!!! | ||
Aesquire |
https://www.breitbart.com/politics/2020/03/30/unio n-2000-u-s-postal-workers-are-in-quarantine-across -america/ Speaking of my Union. It's a high risk job. My prayers for my sisters and brothers. Several Amazon warehouses report cases of Pooh's Breath. There are pages of advice on how to decontaminate your packages. Consider them. The USPS generally doesn't pack boxes. ( unless the original packaging is destroyed by machines while in their care ) so mail contamination will be external only. And viruses don't live long in dry high UV conditions, like the mail processing machines. ( bright fluorescent lighting and UV tunnels are part of the system. ) After all, the USPS learned from the last biological warfare attack. They made changes to equipment and methods. The initial attempts had problems, as the high gamma radiation sterilization procedures caused poisonous outgassing from plastic wrapping on the pallets of mail. That got fixed. So your letter mail is fairly safe. Letters and magazines can be wiped off with a disinfectant wipe or cloth and I'd say you are good. Boxes don't get as much UV, or as complete a coverage. Still, a quick wipe should suffice for safety of the OUTSIDE. However, warehouse packed packages may be internally contaminated...Like The Simpson's episode! So as you process your deliveries at home, you will want to at least wash your hands after unpacking them. Ymmv. Blessings be upon you. | ||
Sifo |
Had dinner, took a walk with the dog, now I see the graphic has disappeared again. Trying to resize smaller. It appears to be working... For the moment... Stop messing with me Blake!  | ||
Blake |
Tom, It's tempting to try to project from a chart, but it's just not sound or valid to do so. For example, look at the Italy plot and pretend you're back at 15 days after exceeding 0.1 deaths per million where you've hit 10 deaths per million. Now project out from there to see where you'll hit 100 deaths per million. How's it stack up to what actually transpired? These plots are not for projecting so much as for comparing so we can see how USA pandemic is faring relative to others. I hope that warmer weather and emerging effective treatments are going to slow the mortality way down. I'm guessing around 30,000, which would be near 100 per million. | ||
Sifo |
Sifo, if, as seems to be the case, the first deaths in the U.S. were actually back in November or October, then the "days since first reported death" figure is way off. Gigo applies here. I'm not arguing for or against your predictions, just have the opinion that the predictions and numbers will change as we fill in the blanks of the past & update the graphs with new ( and old ) information. I would agree with that. It's Blake that is asserting that statistic has meaning. Given the exponential nature of this though, pushing the graph even a couple of days one way or the other can have drastic changes on the right side of the graph. You can easily get that from random differences in how quickly that first person dies. The random issues with that are many. Anytime you are doing statistical analysis with a single data point, you are open to great problems. | ||
Blake |
Tom, A common starting point based on day of 1st death isn't a statistic, nor does it have any meaning. It's just a common basis from which to start the plots. Ya gotta start it somewhere. I've also done that plot starting from 0.5 deaths per million as the starting point. It has no effect on the trajectory of any of the XY non-log plots. It does make a difference when dealing with a semi-log plot. The relative location of each plot sliding left or right doesn't matter. You could just as easily go by actual calendar dates. You gotta stop trying to use the chart to project. It's not valid to do so. You're only fooling yourself. Reading goat entrails or chicken bones may work better. Again, look at the Italy and/or Spain plots up to where they hit 10 deaths per million. Now pretend the rest of those plots haven't transpired yet. If you lay out a projection like you did for the USA, they will be off by a lot. See the problem? In fact, the USA plot is starting to nose over. (Message edited by blake on March 31, 2020) | ||
Sifo |
You gotta trying to use the chart to project. It's not valid to do so. You're only fooling yourself. Reading goat entrails or chicken bones may work better. Again, look at the Italy and/or Spain plots up to where they hit 10 deaths per million. Now pretend the rest of those plots haven't transpired yet. If you lay out a projection like you did for the USA, they will be off by a lot. See the problem? In fact, the USA plot is starting to nose over. Of course any projection is only as good as the stability of external factors. I've been off work for 2 1/2 weeks now. I sincerely hope it's starting to nose over here in the US. Same things happened in Italy and Spain. They took drastic actions, and saw results. Point being, that nose over is much, much easier to see in a log chart. You can simply put the edge of a piece of paper on the plot to see if the straight line is going up or down, even slightly. On the linear chart this is much more difficult to pick out. Here's the thing. People were claiming that it was no more deadly than the flu (you seemed to be backing this idea). If not for the drastic measures taken, in Italy, in Spain, In the US, pick your place at this point, the charts wouldn't be nosing over like that so early. | ||
Sifo |
A common starting point based on day of 1st death isn't a statistic, nor does it have any meaning. It's just a common basis from which to start the plots. Ya gotta start it somewhere. I've also done that plot starting from 0.5 deaths per million as the starting point. It has no effect on the trajectory of any of the XY non-log plots. It does make a difference when dealing with a semi-log plot. It is a single data point though, and it is being given statistical meaning. With the growth we are seeing on this, a doubling every 4-5 days, having the first death be off by 4-5 days is huge at the right side of the chart. I understand that sometimes you have to deal with the data you can get, but some is just not very reliable. Anytime you rely on a single data point, it's a potential problem. | ||
Sifo |
Blake, BTW, thanks for doing that work. Yes, I'm being critical of it, but I really appreciate the time an effort it takes to do that. By doing that, we can all learn things.  | ||
Aesquire |
https://www.xkcd.com/2287/ | ||
Ourdee |
Mayor of Houston Has Solution to Crime | ||
Aesquire |
https://www.breitbart.com/national-security/2020/0 3/31/opposition-iran-spreading-coronavirus-in-syri a-assad-killing-patients-to-cover-it-up/ Assad has a solution too. Shoot the patients and you have a zero rate of Covid-19 deaths. | ||
Ratbuell |
That Houston mayor stole his idea from the Baltimoron...er, Baltimore mayor. | ||
Patches |
US ? Govt Released CoronaVirus Sez ALEXA 31mar20 20secs https://www.bitchute.com/video/MFln41InoVzV/ | ||
Blake |
Hopefully you figured out that I meant to write "you gotta stop trying to use the chart to project." You'd replied before my edit. It's only useful for comparisons of relative pandemic trajectories. A "nose-over" on a semi log chart does not necessarily indicate a deceleration. Trajectory may still be accelerating, or maintaining linear growth. If by nose-over, you mean a deceleration in the death rate, that would evident on a normal XY plot as a downward curvature, or from looking at the trend in the data, if the day-on-day increase is shrinking. | ||
Blake |
Tom: Well, the flu can be pretty deadly. Imagine if we had no vaccines? See the 1917/1918 global flu pandemic. And even now with vaccinations, we've recently seen near 80,000 dead in one flu season here in the USA. Italy has seen 20,000+ dead from flu in one season, near 70,000 in the four flu seasons running from Autumn 2013 through to Spring of 2018. The CCP virus is less deadly to children, more deadly to unhealthy and elderly, people with other health issues. No conclusions are as yet possible as to overal lethality since we have no idea of the size of the infected population at large, and also because as you note, death trails infection, and the pandemic trajectories are still changing rapidly. Even the trajectory in S. Korea is once again accelerating (straight line on semi-log plot). The rate is so low though, that it's no problem at this point. I think you're making conclusion about Italy and Spain that are not supported by facts. How are you concluding that Italy or Spain's pandemic trajectory was mitigated and by what measures? Remember that correlation is not causation. Scientific (not fooling ourselves) analysis requires falsifiable hard data and accounting for all factors that may significantly affect the outcome of what is being observed. This pandemic data so far defies scientific analyses beyond mere observation of actual cold hard scientific data. All epidemics that are not extinction events tend to follow a bell curve type trajectory with early slow onset, then rapid acceleration, followed by a relatively linear growth period, then rapid deceleration relatively linear decline, and asymptotic tail off. That can be the end of it, or like the mutating seasonal flue, it never totally goes away, and follows a cyclic trend. The main point is that there is no solid scientific conclusion to be had from the pandemic data, other than to observe and note what its trend (trajectory) has been so far relative to that in other places. The world has been fooled into thinking that science is capable of helping us know a lot more than it truly can. Two days in a row now, Dr. Fauci has tried to set the record straight about the utility of modelling, that it is only as good as the assumptions used to create it. BRAVO DOCTOR FAUCI!!!. If only the climate crisis alarmists would be so forthright and honest! What may be missing? What say you? Fun stuff. Way better and more fun to discuss than politics! Hahah. | ||
Hootowl |
FYI, and because I’m a spelling Nazi, influenza is shortened to flu. A flue is found in a fireplace.  | ||
Jaimec |
 | ||
86129squids |
Wonders never cease. Sunday morning bad thunderstorm blew my neighbor's tree onto my house so now I've got to deal with that and I have no internet I can only access it through my shity little cell phone. Had to actually drive to the Charter office to let them know they need to reconnect my internet line no way I can reach anybody by phone. It's bad enough to deal with this quarantine extra shity without internet. You guys stay safe looking forward to getting my qwerty keyboard back | ||
Tpehak |
Do you think coronavirus can stop global warming? | ||
Crusty |
It might, Rabbit; it might! | ||
Gregtonn |
When this all blows over we can use all these modeling and graphing techniques to predict the stock market and we'll all be rich. No? G | ||
Hughlysses |
Interesting graph from a guy named Robert Williams, a systems engineer who’s posting these daily on Twitter. 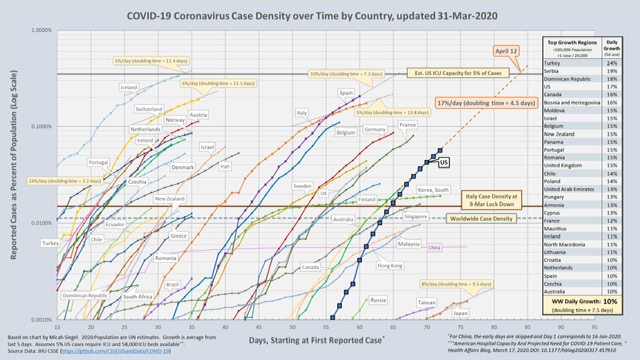 | ||
Tpehak |
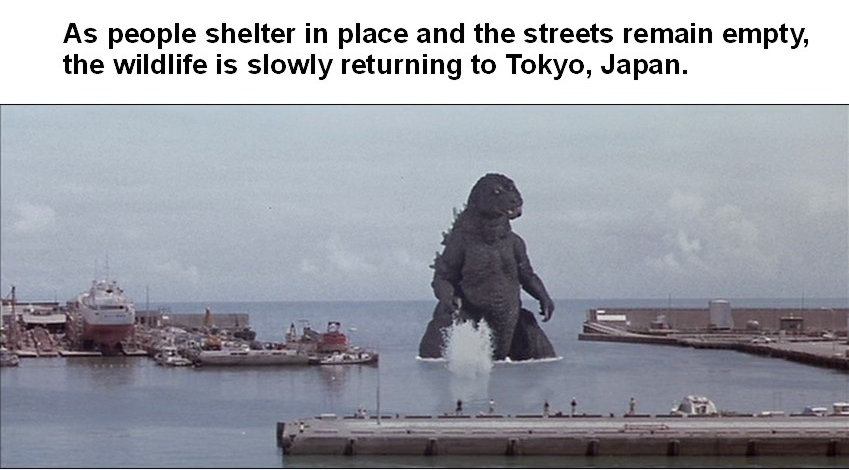
Finally the Nature can breath. The air was newer so fresh in the town. | ||
Court |
Considering that the freshest air in the USA is adjacent to any nuclear power plant. Zero emissions Zero carbon foot print Zero building permits for adjacent industry. Ahhhhhh. . . . . Thank goodness construction is an “essential industry”. :-) |