| Author | Message | ||
Sifo |
I've had many discussions on global warming in the past. One of the things that seems to come up constantly, is if something has been peer reviewed. As flawed as the peer review process has become in this segment of science, I have to admit, the peer review process, in theory is a good thing. This brings up an odd thing though. There are only a few organizations who are keeping the worlds temperature data, and providing the data sets. Even the simple idea of collecting and compiling the data into a single data set is complex enough that the process needs to be open to scrutiny. When you start adding "adjustments" to the data into the mix, especially when the adjustments almost always cause a trend in a single direction, you really need some sort of review process. Yet the organizations, who are paid for with your tax dollars, are very opaque when it comes to the adjustments and their methodologies. Even after some major scandals that pretty well prove bias in the handling of data, there has been no changes in the secretive nature of this process. Do those who insist on peer review say anything negative about this? I've certainly not heard of it. Tod... Any comments? | ||
Alchemy |
Re Aesquire post of 12/6.... At 3:26 is said, "It is not cold water that is the issue. A lot, most of the northern & southern oceans, are the same temperature or colder than glacial melt water. It's the salinity. Fresh water and layers." At 4:16 is said, "So, Alchemy, you are right that glacial melt water is an issue, but it has nothing to do with how cold it is. The waters it's flowing into are actually colder." ... I am familiar with much of what your long and earnest posting reflected and I know you put a lot of work into it. Kudos to you. What you missed in my statement was the word "adding", the verb. You jumped to the word "cold" and did a great job of explaining the ocean conveyer belt actions. The action in climate change is likely to be most impactful in the polar regions. The most simple and obvious result would be the melting of land based glaciers which would add cool/cold/fresh water to the ocean. I think it is fair to state that the adding of a large amount of this water could be troubling. As you uncovered, the ocean already has some very cold water. Adding this freshly melted water would seem to warm the colder water in some cases. Aesquire says: "Also theorized, was that having the entire Arctic Ocean free of ice when winter began would lead to massive snow fall in the North, like "Lake Effect" snow in the Great Lakes region. ( the bane of our existence each year ) Once they surface of the land is covered in snow, it's albedo is higher, and the earth warms less, in a positive feedback loop." I don't disagree with this but it would be important to note that when snow falls on land the albedo impact may be relatively quickly realized but the nature of this effect on the polar oceans may be of more concern in the long run if the ocean ice sheets shrink resulting in the oceans absorbing more heat even as the snow covered land reflects it. I think the oceans are bigger players in the nature of our planets climate. This should be easier to follow than some of the more hidden deep ocean effects. Aesquire says: "So. I want to get off fossil fuels soon and cheap energy to make us all richer." I agree with you there! Cheap energy and lots of jobs could make for an exiciting future. | ||
Aesquire |
I think it is fair to state that the adding of a large amount of this water could be troubling. Ah, I see your point & my misconception, thanks. Yes, the idea that huge floods of fresh water could disrupt the ocean currents is troubling. ...more concern in the long run if the ocean ice sheets shrink resulting in the oceans absorbing more heat... That's not really a problem. Arctic Ocean is generally not going to absorb much heat in winter. The problem is the large surface area for wind to pick up water vapor and dump it on the Northern Hemisphere as snow. One of the reasons I've Long been skeptical of the Global Warming bunch is that we have a lot of evidence of sudden Ice events in history. The "Soylent Green" Hot death scenario, not so much. When they start yelling about "more severe storms" being a problem with the heat rising, It seems bogus, because you get that when it gets colder, and the temperature differences are larger. Again, long term historical perspective. There's a REASON the Vikings were able to sail across the Atlantic and all the way down Africa & into the Med, a thousand years ago. Warm weather, calmer weather. ( overall. Doesn't count Hurricanes, an Atlantic warm water phenomena ) Throw in decades of outright falsified data and a furious dedication to a theory and it's exploitation, and the Climate Con folk just are not believable anymore. Which sucks, for multiple reasons. IF we really do need to drastically alter human life to stop a runaway greenhouse event, it's going to have be be done by dictatorship and force of arms. Much violence, much killing. People that refuse to even admit they are wrong are scary people. And they've already pushed to end free speech and imprison skeptics. If they are slightly wrong, and we do drastic measures to reduce CO2, and THAT leads to an Ice event, we're screwed. Doing ANYTHING drastic with this poor an understanding of the real science behind it is foolish and wrong. I point out that the models, so far, cannot predict the past, so they cannot predict the future. I'll close with a "joke I've been telling for more than this century. "If Global Warming is as suggested, we cannot allow 3 billion Chinese to drive SUV's. The only way to stop that is to murder over a billion people with nuclear fire. Which gives us "nuclear winter" ( an unproven and politicized theory ) and leaves us worse off, and mass murderers." No one likes that joke. | ||
Sifo |
Alchemy, I found a source for the REMSS data set that I can easily download and use. I did that same chart again using that data. It's the current data, so it goes through November of 2015. Other than that, I think it should be quite close to the original chart, but I would guess there may have been some minor adjustments. Anyhow, I again did plots and trend lines starting in 1997, 1998, 1999, and 2000. 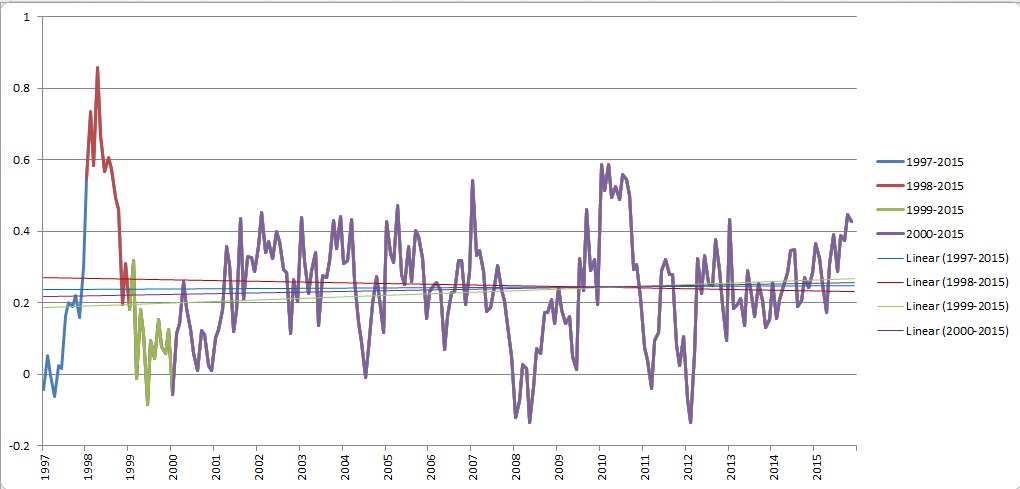 Not sure if it shows what you were looking for or not. Let me know if you want to see something else. Now that I have the data, it's pretty easy to play with the graphs. Obviously this is a monthly data set, like the original chart. It's interesting that 2015 has been a pretty strong El Nino, but hasn't spiked up nearly as much as 1998. It's almost as strong. Maybe the spike will continue into next year. I'm sure the alarmists will be all over it if it does. Here's the El Nino data... 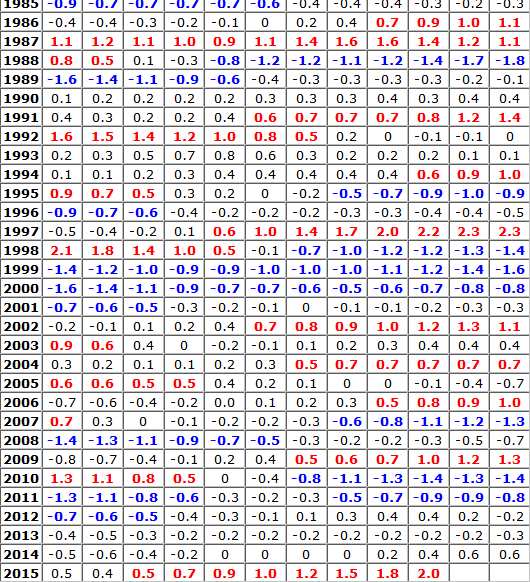 For anyone who cares REMSS data download can be found here http://images.remss.com/msu/msu_time_series.html and the El Nino data can be found here http://www.cpc.noaa.gov/products/analysis_monitoring/ensostuff/ensoyears.shtml | ||
Aesquire |
Great example of how many "cheat" just by picking the beginning date on such charts. If you choose 1000 Anno Domini as your start date we are trending colder overall. Choose 1380 and it's getting hotter. So simple to lie that way. | ||
Alchemy |
Sifo, Glad you were able to work with the direct REMSS data. Here is the graph from the link you posted from REMSS: 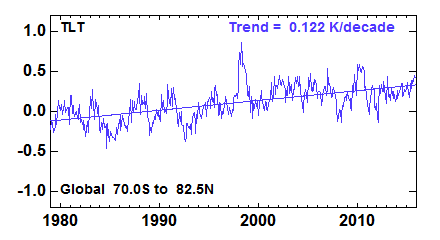 These data from their site do seem to show an obvious warming trend at the latitudes referenced. It will be interesting to watch the impact on the trend line (if any) from the El Nino now happening. | ||
Hootowl |
0.3 degrees over 30 years a trend does not make. Also, if you zoom out a bit, that .3 degrees gets put nicely into perspective. | ||
Sifo |
These data from their site do seem to show an obvious warming trend at the latitudes referenced. Warming trend over that period, yes. A couple of points about that though. We have discussed the effects on the trend when you begin or end your data set on a period that is at the extreme. That data set happens to begin when the alarmists were warning of a new ice age. The next point I would make is that on average, we have been warming for a couple of centuries now. Basically since the Little Ice Age ended. As I pointed out with the HadCRUT3 data set, the warming was actually trending faster before industrial CO2 than since we started building up industrial CO2. The issue isn't "are we warming". The issue is why. When we were warming faster prior to us adding CO2 to the atmosphere, I have a real difficulty blaming CO2 for the now slower rate of warming. Of course the climate is a very complex animal. It's possible that CO2 is a problem being masked by natural variations. The problem is that there just isn't evidence of that. In fact, the argument up to this point has been that the natural variations are being swamped by CO2 warming. Evidence is piling up that it's far more likely that natural variations are swamping any warming from CO2 though. If that's the case, then CO2 just isn't the problem that we've been told it is. | ||
Tod662 |
So ALLLLL the date that alll the worlds scientists use is wrong, but the XBDSYbloddybloddy- THREE as in the third REVISION of the data is right there and all you have to do is plot the points and tada. BUT allllllllllllllllllllllll THE DATA USED BY PRETTY MUCH ALL (97%, OR NOW ARE YOU GOING TO TELL ME THAT IS A BS STATISTIC AGAIN TOO??) THE WORLDS CLIMATE SCIENTISTS ARE WRONG. And the reason for this is that the worlds leaders have this great conspiracy to control people and money. (though not one of you can give me any explanation on how exactly this scheme works). 90% of politicians including almost ALLLLL the conservative parties from the world over are in cahoots with us dirty ignorant climate caring people. How are you the BWBT not scared for your lives? You and the great savior, the GOP,( though not many of your prez con-jokers) is all that stands between the worlds Political and Academical leaders and their goal...... of what again??? Can anybody understand the concept of Occam's razor? Because how the F does this grand conspiracy make more sense the the fact that the people invested in Fossil fuels don't want to loose money? According to this IMF (but they must be in on the take to, their pretty much just a liberal think tank right??) report Fossil fuels are subsidized to the tune of over 5 trillion dollars a year. So what do you think the investment and future earning power is for the people that own this equipment is???? http://www.imf.org/external/pubs/ft/survey/so/2015 /NEW070215A.htm I don't have all the answers but the evidence you have laid out in your pretty little graphs is a joke. The last straw is when you are back again to not understanding the basic science of CO2 as a green house gas. Take a g-damn science course. Oh, did you see the news, that idiot Bill Gates wants to fund Billions of dollars in clean energy R and D, what a bloody moron | ||
Reepicheep |
What kind of an idiot would assume that conservatives would object to a person spending their own money on developing clean energy? You know, like conservatives constantly picket Ducks Unlimited for saving wetlands using member contributions. Oh wait, no we don't. It must be a hard life when you live in a world where you see everything around you as an over simplified comic book of just two extremes. | ||
Aesquire |
What kind of idiot? The kind that can ignore the data. Ignorant of the fact that science does not mean voting proves a theory. Refuses to not use buzzword disproved repeatedly. Believes you can get free stuff from Socialists.... Thinks supporting a cult of oppression and lies will set them free. (Message edited by aesquire on December 11, 2015) | ||
Sifo |
Why Tod, you are special, aren't you? I really didn't realize you were in so deep over your head. You really don't have any clue what's going on, do you? Good luck to ya. | ||
Reepicheep |
It reminds me of the characters in the movie spinal tap. Particularly this part: | ||
Alchemy |
Sifo says, " That data set happens to begin when the alarmists were warning of a new ice age." If you are saying the data is corrupted somehow (I don't think you are), then we could throw it out and go with surface temperature measurements but I would note that the most favorable data in support of the climate skeptics camp is from satellites and this is the source of the data. 1979 starts the beginning of the collected data so avoids any possible suspicion of manipulation of the data. Sticking with conservative data is a solid approach to build on. If the data continues to confirm a warming trend (there are monthly updates) then I would be most attentive to warming in the polar areas and particularly the Northern polar area due to the reflective differences between open water and snow or ice. We have already had some good discussion digging into this already. | ||
Sifo |
It's a funny thing, but when I plotted the data showing the trend lines before and after industrial CO2 periods I just wanted to see how much warming CO2 was supposed to be causing, assuming there are no other factors in such a chaotic system. I was envisioning trying to figure out the exact formulas that Excel calculated to plot the trend lines, or trying to approximate the slopes visually thinking I was getting into a PITA situation to get anything meaningful from it. Imaging the surprise to find that the warming was actually less severe in the industrial CO2 plot. Even I never expected that they might be lying to that extent. Of course, it it possible that after all of the "adjustments" to that data that they've done, which includes lowering temperatures back in the early part of the century, it could just be an artifact of those adjustments. That however would be getting into the validity of the data, which was not the purpose of any of the charts I did, despite what Tod seems to think. Validity of the data is still a very real question, but it just wasn't what was being examined. I really don't know exactly how blinded Tod is on all of this, but his latest reaction is a great character of a classic Progressive when facing facts that they don't like. Ignore the facts and attack the messenger. For what it's worth, I certainly feel better informed having gone through all of this. It's worth it just for that intellectual exercise. I trust that others who may be following this may feel it's added to their understanding too. Others may experience a minor seizure as they try to process it. | ||
Alchemy |
Hootowl says, "0.3 degrees over 30 years a trend does not make." Are we working with facts here or opinions? I like to stay with the facts. The trend is shown in graphs created by Sifo and by the graph created by the satellite data website which is conservative data. The trend is showing warming. The idea put forward of "missing heat" also weakens/disappears based on this data trend. Sifo did a series of graphs with trend lines demonstrating the impact of starting years. The trend lines can be cherry picked by carefully choosing a particular starting year. Choosing the entire satellite data available (starting in 1979 on the webpage) is the least "suspect" and more conservative way of looking at the data as I see it. There are, of course, lots of things to look at, question and examine and it is easy to drift one way or the other but the data should be the most reliable way to go forward. Sifo has done a very helpful job of digging into the data and presenting it. | ||
Aesquire |
Yes. You grasp the essential. You should realize that starting in 1979, the trailing edge of a cold spell, means you will get a warming trend. Start in 2000 and it's level. Btw multiple smart and qualified people have pointed out the data has been adjusted by the Hadley & NOAA. Consistently to support the theory of AGW. The raw data that the Hadley CRU used is gone. They lost it when they moved. I can't make this stuff up. Still. Using the satellite data, we don't see a major or statistically significant change in long term. Gradual warming. Just like we saw in 1965. Me, I'm for warmer. But I live in the lands where it's cold a lot. Ymmv. | ||
Sifo |
Sifo says, " That data set happens to begin when the alarmists were warning of a new ice age." If you are saying the data is corrupted somehow (I don't think you are), then we could throw it out and go with surface temperature measurements but I would note that the most favorable data in support of the climate skeptics camp is from satellites and this is the source of the data. 1979 starts the beginning of the collected data so avoids any possible suspicion of manipulation of the data. Sticking with conservative data is a solid approach to build on. If the data continues to confirm a warming trend (there are monthly updates) then I would be most attentive to warming in the polar areas and particularly the Northern polar area due to the reflective differences between open water and snow or ice. We have already had some good discussion digging into this already. No, I'm not trying to say that the data is corrupted, at least not based on what's being discussed here. My only point is that whatever the starting point of the data being used, it's worthwhile to have it in context. Part of that context is understanding that the late '70s were a period when there was talk of the cold weather being experience just being the beginning of the new ice age. The fact that we started satellite measurements during that time is simply coincidence. It's a coincidence that needs to be understood though, and part of that understanding is that the data series just happens to start at a natural low point. There is a similar thing with the instrument data that is available. The thermometer happened to get invented during a period known as The Little Ice Age. Again just simple coincidence, buy one needs to understand that the data set starts at a natural low period. So what's the "right" way to look at the data? What's the current trend? Difficult questions. Consider the full REMSS data set... 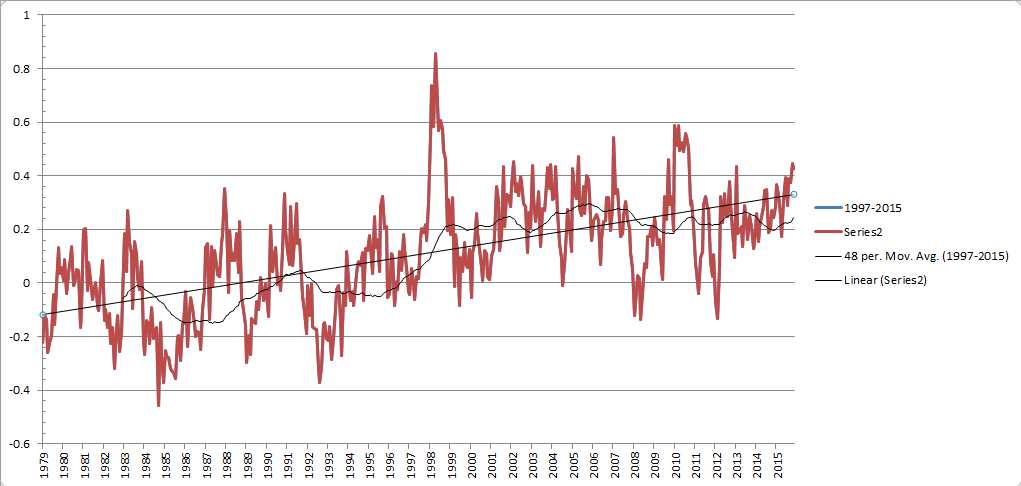 A straight line trend line shows a clear warming trend for the period. No question about it. A 48 month average though, makes the past 19 years look pretty flat. So are we in a warming trend? Suddenly it's not as clear. Of course "warming" isn't really the benchmark we should be looking at. We know we were warming before industrial CO2. The benchmark is trying to prove how much more we are warming due to CO2. I was really surprised that the data I charted to see that difference to show a negative value for the amount of "additional" warming. Of course that isn't proof that warming from industrial CO2 isn't happening. It is a pretty good indication that the amount of warming from industrial CO2 is well withing natural variations though. That in itself means that the climate models used by the alarmists have been way off on the climate's sensitivity to CO2. The honest answers aren't so easy. | ||
Sifo |
Had to cut that last post short without finishing some thoughts. So which trend line is right? Either if you understand what is represented. Neither can accurately predict the future. What is made clear by the moving average though, is that a single straight trend line is probably a poor description of what has happened over that period. Two straight trend lines would describe the data much better, breaking them at about 1998. I did that chart earlier with the HadCRUT3 data. So did we simply rebound from the cooling trend that ended in the late '70s, and stabilize? I really can't say. I kind of doubt it based on the fact that we have been in a much longer term warming trend. Even that longer term trend doesn't predict the future though. What I don't see is a strong correlation with CO2 in the short term (a couple of decades), or the medium term (since the turn of the 20th century). The models have failed their predictions. That much needs to be addressed. | ||
Hootowl |
"The trend is shown in graphs created by Sifo and by the graph created by the satellite data website which is conservative data." Dude. Zoom out. There is no upward trend over any significant length of time that is not well within norms. Certainly not one that can be tied to man made co2. | ||
Chauly |
Throughout all of this "discussion" about climate, at seems like that some basic principles and Laws are being ignored, and there's a lot of s**t falling up. Here are just a couple to display my ignorance: How does a satellite measure temperature of the atmosphere. "When I was a lad" we sent up radiosondes to record temperature as it went up, and then parachuted back to earth to b found by us lads and returned to the National weather service. to read temperature remotely, you need somthing that is in the air to be warmed or cooled. The last time I checked air itself has a negligible emissivity. Next why would an incresee in air temperature os a couple of degrees melt glaciers and kill polar bears. it takes a while to melt a block of ice, even if it is floating in warmer waters, and forever if it has a a bit warmer air from -20 up to -10, no positive =stays frozen. And why would heat be "stored" in the ocean depths? heat rises, and if the upper layers of warm water (thermoclines) exist, there is no reason for the heat to burrow downward. And that's just three? (Message edited by Chauly on December 11, 2015) (Message edited by Chauly on December 11, 2015) | ||
Chauly |
I have to apologize for my typos. I just had a stroke, and it's •••••• up my hunt-and-peck typing. | ||
Aesquire |
The satellites record ground & air temps in a column from Earth to space. Mostly ground, as you said, air doesn't radiate that much. Over long periods of time, a one degree change will change how fast ice melts. Mostly the glacier thing is hype and lies. Not all. Remember the Indian scientist who reported the glaciers in the Himalayas were disappearing? Made it all up. Made money. Never made it actually to the Himalayas. But it is real. Ice in Greenland has finally melted off some Viking settlement abandoned around 1350. Lots of signs of warmer weather there. They used to grow rye. Not today. Still too cold. So it's happening that some ice has melted. Other places there's more. The deep ocean heat b.s. is probably pure guesswork and cya. When temperatures didn't go up as predicted after 1998, some very dishonest folk probably made it all up. The same folk that tell you every year is the hottest on record. The worst part of the Climate Con isn't the tax they want, or the dictatorial control over your life, it's the destruction of trust in the very idea of Science. The boy who cried wolf. When some dude tells you you should move because the mountain you live on will explode soon, why should you listen? Because he may be speaking from a background of repeated observations, of ground movement and shaking, & it's been shown in the past that a mountain just like yours blows up when x & y happens. Or he could be a con man who wants your land. So if you are smart, you ask a different scientist if you're in danger AND if the first guy has a good record of predicting eruptions. We got nearly 18 years of bad predictions for the Global Warming crew. | ||
Ducbsa |
From noted climate scientist John Kerry: "If all the industrial nations went down to zero emissions �- remember what I just said, all the industrial emissions went down to zero emissions -� it wouldn�t be enough, not when more than 65% of the world�s carbon pollution comes from the developing world." http://wattsupwiththat.com/2015/12/10/again-why-ar e-we-there-john-kerry-admits-at-cop21-that-us-emis sions-cuts-accomplish-nothing-for-climate/ Comments on that: http://www.powerlineblog.com/archives/2015/12/on-g lobal-warming-follow-the-money-2.php | ||
Alchemy |
Hootowl says, "Dude. Zoom out. There is no upward trend over any significant length of time that is not well within norms." There is no Zoom out that I know of. We are looking at the orbital satellite data over the entire data set. This is the least manipulated view. The data confirms warming. Sifo agrees to what the complete data set shows. There are certainly many vigorous disagreements in the progress of science. When you try to bolster an interpretation based on selective data, it weakens a position. This weakening applies to any position. This does not mean the position is not to be considered, it just means it must be very compelling to have traction. The reason this satellite data is being examined is because a selective set of data starting about 1997 or 1998 can yield a nearly flat trend line showing no warming. This data has been posted in this thread previously (see 18 yr 3 month graphic up thread). Even that selective data is likely to trend up as the impact of the present El Nino enters the data in the coming year or so. it becomes more and more difficult to slice the data to get to any graph that does not show warming. Not impossible but difficult. | ||
Sifo |
Even that selective data is likely to trend up as the impact of the present El Nino enters the data in the coming year or so. it becomes more and more difficult to slice the data to get to any graph that does not show warming. Not impossible but difficult. You may be right about the current El Nino. With or without that, what is the benchmark to provide evidence for warming from CO2 though. I would have to say that I would expect at the very least a trend that warms faster than we had prior to industrial CO2. Agreed? | ||
Alchemy |
Chauly asks, "How does a satellite measure temperature of the atmosphere. "When I was a lad" we sent up radiosondes to record temperature as it went up, and then parachuted back to earth to b found by us lads and returned to the National weather service. to read temperature remotely, you need something that is in the air to be warmed or cooled. The last time I checked air itself has a negligible emissivity." Very sorry to hear of the stroke. Your question is a good one. First, there is data collected by traditional means from land and ocean as you mentioned. The website we are looking at are specialists in remote sensing mostly by means of interpreting infrared spectra. The REMSS.com website has interesting information on their site. They are looking at data from satellites in polar orbit. From what I can tell the data over land is easy in comparison to the data over the oceans. There is the air column above the water and then the surface and beneath data to consider. Tough science. In the terms of the climate debate, this data (Satellite) has been the preferred data set for climate warming skeptics. Traditional methods of measurement are suspect as being too easy to manipulate by humans. The great thing about the satellite data is that it is pretty good about gathering ocean data. Oceans being larger and more important than land data. And it is great at gathering polar data. The land data has shown warming more quickly than the ocean data in general. The question is where is the tipping point for the oceans if there is one? So we have to wonder what a half a degree or so change in the oceans over a few decades means? Whatever it means will probably be more evident in the polar oceans first. | ||
Alchemy |
Aesquire says, "So if you are smart, you ask a different scientist if you're in danger AND if the first guy has a good record of predicting eruptions." The flaw in this approach is that as they say in the stock market, "Past performance is no guarantee of future results". Remember that in your example you are potentially betting your life on a volcano prediction and you probably are not going to get a guarantee. You might want to ask 100 guys vs 2, particularly if their families also live near the volcano. But still no guarantee of course. So are scientists corruptible? Sure but it becomes easier to detect these corruptions over time and science tends to make corrections particularly when there is active research happening. When research in various areas tends to converge on a particular theory then that theory gains credence. It usually requires a competing theory to supersede a previously held theory in science. | ||
Alchemy |
Sifo says, " A 48 month average though, makes the past 19 years look pretty flat. So are we in a warming trend? Suddenly it's not as clear." Clarity! that is hardest really. Looking at 48 months is interesting but it is hard to find a justification for that analysis other than it varies (for now) from the longer view. Sifo says, "What I don't see is a strong correlation with CO2 in the short term (a couple of decades), or the medium term (since the turn of the 20th century). The models have failed their predictions. That much needs to be addressed." I have focused on looking at the satellite data precisely because of clarity. We need some points of agreement because there are surely more difficult and murky questions. Pursuing those more murky questions is unlikely to provide similar clarity and who wants to just descend into arguing. So if we are to look at CO2 then the first thing I would be looking at is the data sets and I suspect they will be murky pretty quickly due to the numerous sources of carbon manipulators including geology, biology and man for a start  As a general statement, what are your data sets showing over time? Maybe long, medium and short? Again, I appreciate what you have done and I am respectful of your efforts so no worries or expectations. My expectation is that CO2 is rising but lets peek at it. Also, I am not overly concerned about failing models because I would expect it to be the case as the models are improved. It is a recursive process hopefully moving toward closer accuracy going forward. I would pay more attention to trends - getting better or getting worse. | ||
Aesquire |
So you are ok with them taking your money based on a model that does not work? Sure, someday the models will be better. I say wait until you can predict last decade before you tax me. Ask 100 people who live nearby? Why? Is the accountant next door an amateur vulcanologist? Find out first if the doomsayers ever predicted an eruption. And maybe if they are getting paid by people expecting to get rich off you. Full disclosure. I once had a job with an oil company. Never got paid or went to work. Because of Jimmie Carter. ( Iran ) |