| Author | Message | ||
Sifo |
So for a while now, I've been curious about something. I was wondering how the trend line prior to industrial CO2 compared to the trend line from the industrial CO2 era. Assuming CO2 is a real problem with global warming, the trend line MUST CERTAINLY show much faster warming after we started adding CO2. RIGHT? So I plotted the data since 1900 to find out. I used 1945 as the start of industrial CO2. I've never seen this done before BTW. Here's the results... 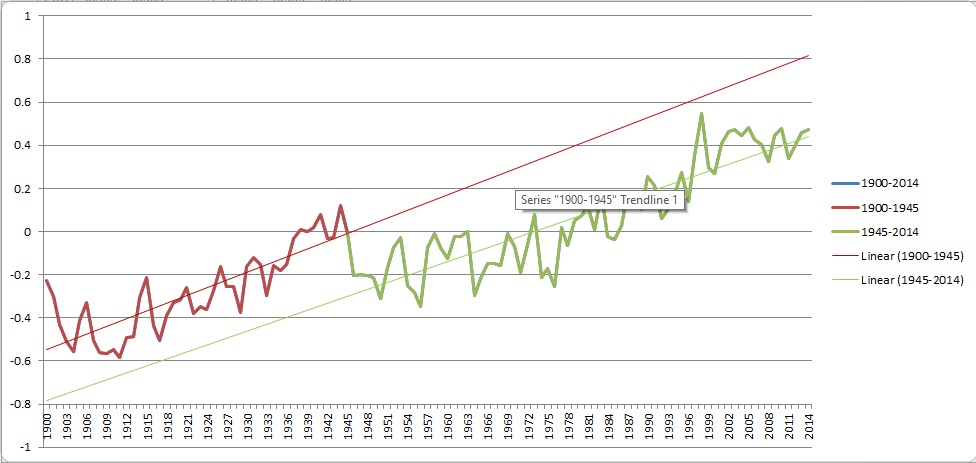 I have to say that I am surprised to see that the warming is actually slower now that we have all this extra CO2. Data is the HadCRUT3 I've been playing with. Tod... Comments? | ||
Alchemy |
Sifo says, "No, I never thought you were trying to be difficult." No, not taken that way. I realize that it is work to do graphs so I appreciate your effort. The RSMSS data seems to be in plain text - see the link in the original 18 yr 3 mos graph. I am not sure it is simple to make sense of the data however. They draw a distinction to the numbers based on latitude it seems. To your graph, the indication I was looking to see is most clear in the difference in the green linear trend line and the purple linear trend line. What I would call the slope of the green line is more notable than the nearly flat purple trend line even though they start only one year apart. I am in agreement that such skewing can cut various ways. An example may soon be available since we are currently once again in the midst of an El Nino event so when the data comes in through 2015 and 2016 it may have another significant effect similar to the spike around 1998. Tisdale, hummmm... yes he is making his voice heard. | ||
Sifo |
So back to addressing some of Tod's issues. A climate model is supposed to test your assumptions. The main assumption in question is the climate's sensitivity to CO2. Based on those models, CO2 was supposed to not simply keep a straight warming trend, but due to various positive feed backs, have the rate of warming increase over time with the added CO2. We know that didn't happen. There was a pretty clear change around 1998. 1998 was also a pretty strong El Nino making it a strong anomaly. I chose to start the plots for this in 1979 since it's a favorite year of the warmists, and the first year of satellite data. I plotted before 1998 and after with separate trend lines to see the difference. I left 1998 out of both trend lines. 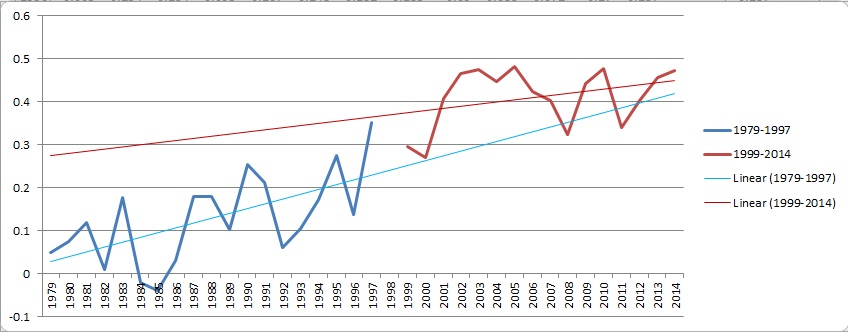 So what's important about all of this. Remember we are testing the climates sensitivity to CO2. The trend went the exact opposite direction. Failing to show other natural variables, if you are honest, you have to acknowledge that the assumptions in question are wrong. Of course, for the warmists to acknowledge a natural variable that has this capability, is to acknowledge that natural variables are much stronger than the CO2 variable. They don't like that. Time's short and I must run. Comments? | ||
Alchemy |
Sifo, Regarding your assumption, "...the trend line MUST CERTAINLY show much faster warming after we started adding CO2." It seems the discussion is moving a bit beyond "is there warming" to a question of what is the prime actor in the warming? My position would be that I would have to recognize that initial warming could begin to increase melting of land based glaciers. New glacial melt-water entering the ocean would/might have some mediating effect on the rate of warming versus before the glacier melting accelerated. I would expect some anomalies that would have to be corrected in the model to perfect it. So I don't think I would expect too close a correlation with Carbon emmissions but a trend of rising fits and starts. For example as the polar ocean ice melts over time then the rate of change would have to be adjusted and once all the glaciers are gone again the rate of change would have to the corrected once again. This is it for me for a day or so. Enjoy the weekend. | ||
Tod662 |
So all the worlds scientists data is corrupted but the BWBT is able to find the real numbers for all these pretty little graphs, wow you guys are something. You better watch out, Gore's Cobra Con goons are going to be wanting this kept secret! Whats the end game, how does it work? "derr, its about our worlds leaders wanting money and power" is all that has been said. Just how does tricking all the worlds leaders and many of the richest business people into the ruse accomplish what exactly. can anybody explain Occam's razor? Ok let me see the raw data behind that last graph and what calculations are done, how things are extrapolated. | ||
Aesquire |
This is not supported by the larger more complete data. I disagree. The rate of warming, a long term phenomena from the last ice age, is highly variable. On a short time scale. It was hotter 1000 years ago than it is now. There is still a long term warming trend, which will end very soon, ( on a geological time scale ) even though it was warmer when Spartacus got crucified. The general trend, long term is still real. The short term trend, since the second warmest year on record, 1998, has been flat. ( from not adjusted data. ) The warmest year on record, AFAIK, was 1938. Micheal Mann's "hockey stick" graph doesn't have the Medieval warm period, or the little ice age after, doesn't even show the bad years when you could haul cannon across the Delaware river on the ice. After reading his e-mails from the Hadley CRU, I'm convinced he is a fraud. True, the University President declared him free of suspicion of fraud, ( he brings in a lot of money ) and also ignored a child diddler coach for years, ( football brings in a lot of money ) so take that judgment for what it's worth. While I understand that a fellow like Obama can't actually lie ALL the time, or he'd never get what he wants for lunch, after enough lies you should learn to distrust & verify. ( To steal from R. Regan ) In short, if Obama, Clinton, Mann, Hanson.... and probably Jeb, told me the sky was blue today, I'd check before believing them. ( it was not, it was gray ) | ||
Sifo |
Ok let me see the raw data behind that last graph and what calculations are done, how things are extrapolated. Well, I've been about as transparent about what I've been doing as I can. The data is from the HadCRUT3 data set. I proveded the link for the data when I started posting these graphs. Anyone is free to download the data for themselves to verify that I'm not doing anything to manipulate the results. To be as tranparent as possible though, here's the raw data used... Year Temp Anomaly 1979 0.049 1980 0.076 1981 0.12 1982 0.01 1983 0.177 1984 -0.021 1985 -0.038 1986 0.03 1987 0.179 1988 0.18 1989 0.102 1990 0.255 1991 0.213 1992 0.062 1993 0.106 1994 0.172 1995 0.275 1996 0.137 1997 0.352 1998 0.548 1999 0.297 2000 0.271 2001 0.408 2002 0.465 2003 0.475 2004 0.447 2005 0.482 2006 0.425 2007 0.402 2008 0.325 2009 0.443 2010 0.478 2011 0.34 2012 0.403 2013 0.457 2014 0.472 You can copy it into an spread sheet of your choosing, graph it, and add trend lines. The graphing and trend lines are all functions of the spread sheet. It's exactly what I described in the post with the graph. | ||
Sifo |
My position would be that I would have to recognize that initial warming could begin to increase melting of land based glaciers. New glacial melt-water entering the ocean would/might have some mediating effect on the rate of warming versus before the glacier melting accelerated. My gut tells me that the math will never work out in your favor. Then again, data and math can prove my gut wrong. I'll be the first to admit that such calculations would be beyond what I could manage, assuming I had the data. Getting meaningful data for this would likely prove even more of a challenge. It would be interesting to read if anyone has done a paper on such a theory. Please post it up if you can find it. | ||
Aesquire |
http://www.pocket-lint.com/news/129913-world-s-fir st-thorium-reactor-ready-to-be-built-for-cheaper-s afer-nuclear-energy | ||
Ducbsa |
Safe enough for the Progs? Or is solar and wind just too delightful to give up? | ||
Ducbsa |
Money and Power Drive Obama's Climate Agenda http://www.americanthinker.com/articles/2015/12/mo ney_and_power_drive_obamas_climate_agenda.html | ||
Sifo |
Safe enough for the Progs? Or is solar and wind just too delightful to give up? When you are in search of a problem, you aren't really interested in a solution. | ||
Sifo |
It dawned on me this morning that when I do a little bit of simple graphing using data that is publicly available, and explain where I got the data, and what I did in the graphing of the data, Tod gets suspicious that I did some unethical manipulation to prove my point. At the same time, he seems to have no problem with this...  or this... 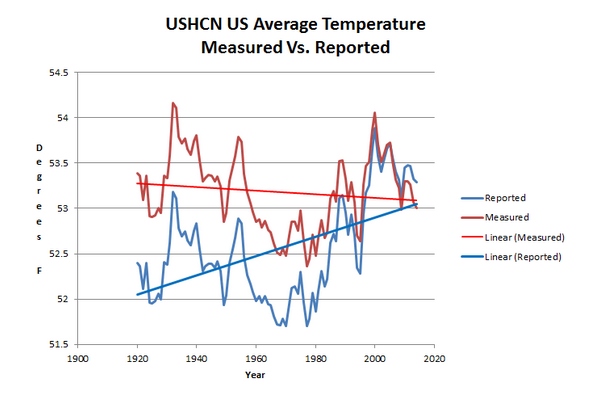 and the people who are doing those "adjustments" are very secretive about their methods, and didn't even make it known that adjustments were being made. The irony is almost painful! BTW, thanks to our freedom loving rodent for posting those charts up for us.  | ||
Blake |
Empiricism (using actual historic data to discern trends) is best for figuring climate sensitivity. This is pure genius, and every climate scientist knows it: http://wattsupwiththat.com/2014/07/23/new-paper-fi nds-transient-climate-sensitivity-to-doubled-co2-l evels-is-only-about-1c/ Todd, it's not that there is no warming. It's that there is no cause for alarm, because the predictions made by the alarmists have proved false. Climate sensitivity is nowhere near what they said was a cause for alarm. More to follow. | ||
Sifo |
I've been wanting to get back to Tod's post from Thursday, December 03, 2015 - 09:53 pm: I'll take one point at a time... So can it be generally agreed "we have a energy problem" ?? And that fossil fuel companies are subsidized at way to much money? No and no. At least energy is no more of a problem than any other time. Yes, we will at some time have to get off of fossil fuels. That's a long time in the future though. In 1979 I was taught in school that we would run out of oil within 20 years. I was also taught that burning of those fossil fuels was going to cause another ice age. It was explained how terrible it was going to be in the cold without energy to heat your house. Terrible fear mongering to drop on a fourth grader! The same crap continues today. What fossil fuel companies are subsidized? Sure, like any other company, they take advantage of tax breaks where they can. When Exxon was making record profits, they also payed record tax revenues. Not records for Exxon, but all time records for any US company. That's a far cry from subsidizing a company, which is being done with numerous "green" companies. Simple economics of about any school say tax something that is bad, thus a carbon tax makes sense, right? What better way to incentivize companies to do better. And this is a very important point. Why exactly is carbon bad? The default position for the greenies is that it causes global warming. The extent of that is very much in dispute as I have demonstrated and as the article Blake posted points out. It's becoming quite clear that the amount of warming will be a fraction of what we have been warned about. Is that even bad though? Not if past history is any indicator, and it probably is. The Medieval Warm Period was known as a period of good times as life goes. Climate played a big part in that. We keep being told that global warming is going to cause mass extinctions, but the Earth experienced it's highest level of biodiversity when the climate was warmer than what the alarmists have been warning us about. Something simply doesn't make sense there. OK back to the issue at hand. The only real evidence I have heard against man made climate change is the supposed stop of warming, it has not stopped (nobody says anything about every year being the hottest on record, or are all of today's thermometers lying?) but it has slowed recently (what is the current solar cycle??). If you have science that disputes whats below, lay it on me, but if these links are true, well there ya go. Who said it had "stopped". The climate changes. It always has. It always will. You raise a false argument. The warming has failed to keep up with even the low error bars of the climate models though. That is called proof that the models are wrong. If the models are wrong, then our assumptions about the climate's sensitivity to CO2 are wrong. That is what was being modeled after all. Here is a quote from the link I added from the co2/ temperature graph that talks about the lag. https://www.newscientist.com/article/dn11659-clima te-myths-ice-cores-show-co2-increases-lag-behind-t emperature-rises-disproving-the-link-to-global-war ming/ "The ice ages show that temperature can determine CO2 as well as CO2 driving temperature. Some sceptics � not scientists � have seized upon this idea and are claiming that the relation is one way, that temperature determines CO2 levels but CO2 levels do not affect temperature. To repeat, the evidence that CO2 is a greenhouse gas depends mainly on physics, not on the correlation with past temperature, which tells us nothing about cause and effect. And while the rises in CO2 a few hundred years after the start of interglacials can only be explained by rising temperatures, the full extent of the temperature increases over the following 4000 years can only be explained by the rise in CO2 levels. What is more, further back in past there are examples of warmings triggered by rises in greenhouse gases, such as the Palaeo-Eocene Thermal Maximum 55 millions years ago (see Climate myths: It�s been far warmer in the past, what�s the big deal?). Finally, if higher temperatures lead to more CO2 and more CO2 leads to higher temperatures, why doesn�t this positive feedback lead to a runaway greenhouse effect? There are various limiting factors that kick in, the most important being that infrared radiation emitted by Earth increases exponentially with temperature, so as long as some infrared can escape from the atmosphere, at some point heat loss catches up with heat retention." And you find a source that used the same tactics I pointed out you using. Answering a question that isn't being asked. Who has said that CO2 does not affect temperature? No one in this discussion. He claims that only CO2 can explain the warming, but how do you explain the lack of warming in recent decades when warming is supposed to be accelerating? Time for this guy to reexamine what he "knows". Here is a quote from the link I added from the co2/ temperature graph that talks about the lag. https://www.newscientist.com/article/dn11659-clima te-myths-ice-cores-show-co2-increases-lag-behind-t emperature-rises-disproving-the-link-to-global-war ming/ "The ice ages show that temperature can determine CO2 as well as CO2 driving temperature. Some sceptics � not scientists � have seized upon this idea and are claiming that the relation is one way, that temperature determines CO2 levels but CO2 levels do not affect temperature. To repeat, the evidence that CO2 is a greenhouse gas depends mainly on physics, not on the correlation with past temperature, which tells us nothing about cause and effect. And while the rises in CO2 a few hundred years after the start of interglacials can only be explained by rising temperatures, the full extent of the temperature increases over the following 4000 years can only be explained by the rise in CO2 levels. What is more, further back in past there are examples of warmings triggered by rises in greenhouse gases, such as the Palaeo-Eocene Thermal Maximum 55 millions years ago (see Climate myths: It�s been far warmer in the past, what�s the big deal?). Finally, if higher temperatures lead to more CO2 and more CO2 leads to higher temperatures, why doesn�t this positive feedback lead to a runaway greenhouse effect? There are various limiting factors that kick in, the most important being that infrared radiation emitted by Earth increases exponentially with temperature, so as long as some infrared can escape from the atmosphere, at some point heat loss catches up with heat retention." So you post not one, but three articles that all have different explanations for the pause in the warming, but the end result is that CO2 is still the only thing that can cause the change we have experienced. The obvious flaw in this logic is that the argument up until now has been that natural variations simply aren't strong enough to cause what we were seeing. Now we have not one, but three theories for natural variations that do have that much power. The problem with any of these though, even if they are correct, is being newly discovered forcing of the climate, we lack historical data. We don't know how much effect they can have, and we don't know what effect they have had in the historical records. You can't simply say it had that much power for the past 15 or 20 years and ignore it for the rest of recorded history. That's just bad science. In fact if the argument is that we have found a pair of ocean oscillations that usually cancel each other out, but have gradually gotten out of sequence and are together causing a multi-decadal cooling effect, chances are pretty good that on either side of that cooling effect you will get a multi-decadal warming effect also. To say that this exists in nature is to say that it's a new uncertainty of your CO2 theories. whoever keeps saying "why cant we show where the heat is going with satellites", doesn't this explain it? Its like a conveyor belt, have you guys taken this deep circulation into consideration? As a matter of fact, yes. This didn't just start 15 to 20 years ago though, did it. Again, to even suggest that it's fluctuations have the power to effect temperature as much as you are saying, is to suggest that it's fluctuations have been doing so throughout recorded history. That's one more large uncertainty that is not accounted for in climate models. It's funny that after so many years of alarmists claiming that the climate simply doesn't have the natural fluctuations as large as we have been seeing, those same people are now arguing in favor of those natural fluctuations to explain the lack of warming. I guess it's kind of nice to see the alarmists finally adjusting their thinking to some extent. It's far better than adjusting the data. They have a real problem though, as those natural variations make the climate that much more difficult to understand and predict. They won't admit it, but they are gradually coming to grips with what the skeptics have been saying all along. | ||
Aesquire |
At least energy is no more of a problem than any other time. Yes, we will at some time have to get off of fossil fuels. I disagree. Certainly there are political reasons that the price of oil has gone up, but really it's that Saudi Arabia etc. have pumped a lot, most, of the handy oil. Texas isn't the major oil producer it once was, and has a lot of well that are capped, waiting for the price to be high enough to be worth pumping steam into the bore to get more out. Yes, we have a bunchaton of oil available from fracking, ( but Not in New York, the Governor has decided ) but that oil costs More than oil you just have to drill for. Coal to oil, that we paid tax dollars to develop back in the Jimmie Administration, was only profitable at the time if oil was more than $55 a barrel. So... yes we should have enough oil to safely, and reasonably cheaply, transition to other fuels. And we have to do so, for multiple reasons. The simplest is that the oil will run out. The more important part is that cheap energy is Wealth for a civilization. Oil isn't going to get, or stay, cheaper than it is today. One little war, One annoyed Putin, one ambitious Saudi Prince, one well planned sabotage of a major oil terminal, ( say, the one in Iran feeding China ) and it's $5 gas or even $10 or more. Remember the Jimmie Years? Gas lines and rationing? So while I am not at all in favor of a carbon tax, and mock the concept of taxing sins to change behavior in this case, we do need to work towards the future. If you want electric cars you need More power plants. If you still want to use the grand machinery of the 20th century, your Buells, Corvettes, Bonanzas, you need a substitute for gasoline. Right now there are multiple companies working on synthetic replacement fuel for 100LL aviation gasoline. There are a LOT of old planes that still use high octane leaded gas. And really can't be converted practically. 93 Sunoco super premium doesn't cut it in 100 octane engines. | ||
Sifo |
Well first off, oil is only one type of fossil fuel. It is probably the first that will be a problem though. Even oil though, I'm told isn't going to be a problem for a long, long time. I got this from a retired executive at United Oil Products. I guess you could say that someone in the oil business might not be telling the truth about this, but why would he lie to people that he knows socially? I'm going to assume that UOP knows a thing or two about the core of their business. Beyond that, I really don't know with any certainty. I do know I've been hearing of the impending doom since I was a young kid. Other fossil fuels, such as natural gas and coal are quite plentiful. They will certainly be around for a long time to come. We do also have some pretty huge oil reserves in western states that are virtually unexplored, and will remain so as long as our government says so. You are right in that oil will continue to get more and more expensive. That creates market pressure to find other alternatives. Real alternatives, not the ones that politicians pick as winners, such as CFL light bulbs that are already being surpassed by LED bulbs. Ethanol is another crappy alternative fuel brought to you by a government solution. The free market would never devise such a failure of a solution. So yes, we will have time to transition to new energy technologies. They too will undoubtedly be dependent on finite resources. Then again, we may just kill ourselves off before we have a chance to run out of oil. I really don't know. | ||
Aesquire |
http://www.nationalreview.com/article/427640/orson -scott-card-naysayers | ||
Alchemy |
Asquire says,"If you want electric cars you need More power plants." This might be an interesting discussion. I like higher performance so I want more electric cars. I wonder if anyone else thinks like that? I wonder if the brainiacs on Wall Street are thinking like that. I wonder what the 5 year trends on a stock like Exxon (XON) looks like compared to GE? Really, it is hard to beat electricity for efficiency and performance and it has pretty good headroom for continued improvement. Of course, battery technology stinks but improvements are really just getting started there. Someone is going to figure out a better battery and then we will see which big company (XOM, GE?) buys them. | ||
Sifo |
Good story Aesquire. I've played a bit more with the HadCRUT3 data. I thought it would be interesting to see a variety of trend lines all on one chart for easy visualization of how "serious" the global warming problem really is. The first plot is for 1945 through 2014 and labeled Industrial CO2. Then we have 1900 through 1945 labeled Pre-Industrial CO2. Then I added 1979 through 1997. This would be the heyday years of global warming, so to speak. Industrial CO2 had built up quite a bit, and it's prior to the poorly explained missing heat era. Finally I added our current missing heat era which goes from 1999 through 2014. Note that 1998 has been left out of both of the last graphs because it is an explained anomaly year that really skews both trend lines. I encourage you all to be free mice and decide for yourselves what you see in this chart. What I see is a single trend line that is very different from the rest. The heyday period for CO2 warming isn't even as steep as the pre-industrial CO2 warming. 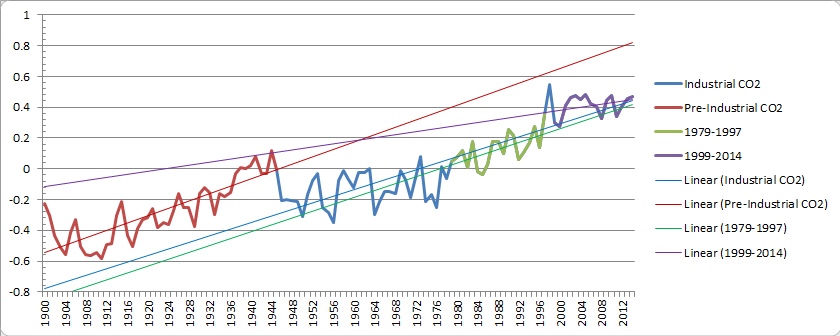 I really don't know what explains the 1999-2014 trend. It very well could be ocean cycles that have gotten into phase where you see a cooling trend at the surface. It could also be a reduction in Sun spots. I really need to search how that theory is holding up. If it's ocean currents, it would sure be nice to see the data. What is clear, is that there has been a clear break from rising CO2 levels. Of course, I don't see the rising trend from rising CO2 levels either. Perhaps Tod will be good enough to let me know where I've gone wrong on all of this. One thing I do wonder about though. It's a proven fact that they have adjusted the data to show an increased warming trend. I really wonder what the trend lines would look like with the raw data. Unfortunately, that's just not going to happen. You can thank the keepers of the data for that! We need far more transparency in those institutions. Institutions which BTW really subsidized by the government. Let that soak in for a while. Anyone have any other ideas of what might be interesting to chart. I know I've got a couple things I want to look at yet. | ||
Alchemy |
Sifo says from a few posts back, "My gut tells me that the math will never work out in your favor. Then again, data and math can prove my gut wrong." There is no doubt that the goal of understanding and predicting climate is daunting. I don't have a paper to reference on how adding cold water into the ocean will effect climate but there is probably something out there. I like gut feelings as a start to research but bad things happen if a person sticks with gut feelings too long after the data is going the another way. | ||
Aesquire |
It is not cold water that is the issue. A lot, most of the northern & southern oceans, are the same temperature or colder than glacial melt water. It's the salinity. Fresh water and layers. The result of global warming is Ice Age. I reference Newsweek magazine from 1977. | ||
Aesquire |
http://www.livescience.com/31810-big-freeze-flood. html This deluge would have diluted the circulation of saltwater in the North Atlantic, disrupting the ocean "conveyer belt."that cycles warm water up to the Arctic, where it cools and sinks and travels back south along the ocean floor. With less warm seawater moving poleward, temperatures across the Northern Hemisphere apparently plunged. The fear, back in 1977, ( and just as valid today ) was that IF there were large scale melting in Greenland, ( and there has been some, uncovering Viking settlements long buried under snow ) that the fresh water would disrupt the Gulf Stream & other sub surface flows, leading to COLD and BAD Times. Also theorized, was that having the entire Arctic Ocean free of ice when winter began would lead to massive snow fall in the North, like "Lake Effect" snow in the Great Lakes region. ( the bane of our existence each year ) Once they surface of the land is covered in snow, it's albedo is higher, and the earth warms less, in a positive feedback loop. All leading to a mini ice age, since we aren't quite due, yet, almost, for the real Deal. So a thousand years of death, starvation, doom & gloom. ( which may or may not lead into the multi thousand year Big Ice Age which is primarily a orbital dynamics issue, not a Solar cycle one. So, Alchemy, you are right that glacial melt water is an issue, but it has nothing to do with how cold it is. The waters it's flowing into are actually colder. In any event, while there had been some glacial melting, much more than reality has been claimed, for example the fellow in India who completely faked a study, that the Himalayas were melting, and never even saw a glacier. Got money though. And that, in the final analysis, is the greatest danger of the Global Warming Con. The Boy who cried wolf. If we can't trust scientists to give us the truth as they understand it, we won't listen to them anymore. So when a Comet is on it's way, or the Yellowstone Supervolcano is ready to erupt, or it turns out that wifi kills bees, people won't prepare for, or change habits, to mitigate the problem. And for that, you can blame the Green Movement, and the Green Party, for embracing the Soviet system of Lie to get power. ( and in the case of the Greens in Europe, which was actually created by the Soviets to ruin western industry, the Lie To Power part is structural, built in, Designed in. ) further reading. https://en.wikipedia.org/wiki/Milankovitch_cycles Note that this well respected theory has it's problems. Also, and it bears repeating, it seems that CO2 rises in the atmosphere take place AFTER a solar induced warming period begins as the oceans give up dissolved CO2 as they warm. Cause and effect, baby! CO2 is certainly a greenhouse gas. Methane is a more powerful one, and so is water vapor. In fact the Arrhenius theory on greenhouse gasses uses water vapor & CO2. https://en.wikipedia.org/wiki/Svante_Arrhenius#Gre enhouse_effect So. I want to get off fossil fuels soon and cheap energy to make us all richer. I don't want to pay a tithe to a religion I don't agree with. | ||
Sifo |
I know this is a bit old, so the numbers may have changed slightly, but I'm pretty sure the math and physics is still the same. Global Warming: A closer look at the numbers Spoiler alert! The bottom line is that by these calculations, the total greenhouse effect from all man made greenhouse gasses is only about 0.28% of the total greenhouse effect. That's ALL gasses, not CO2. Man made CO2 by itself only represents about 0.117% of the total greenhouse effect. It's a very worthwhile read IMO. It illustrates why understanding water vapor in our atmosphere is key to understanding how our climate works. For far too long water vapor has been treated as a constant in climate models. In reality, nothing could be further from the truth. I know that less than a decade ago, there was a very real disagreement as to the direction of the forcing caused by additional water vapor in the atmosphere, much less the amount of that forcing. I know I read a few years ago that there were finally some studies being conducted to improve our understanding of the effects of water vapor. It's very difficult though because you can't really to laboratory experiments to mimic ocean evaporation and cloud development. All you can really do is observe, measure, and document what is happening to the Earth. I'm glad they are finally looking at the water vapor variables, but I doubt we will really have much solid data on this for a long time to come. I'm sure Tod can explain how this is all oil company propaganda. | ||
Sifo |
So there was a theory that sun spots are related to global temperatures because of a variation of the amount of cosmic rays and how they affect cloud formation. I honestly haven't looked into it for a long time, but the theory did predict that if we have a period of less sun spots, you will see lower temperatures. Naturally the alarmists dismissed this theory, even though the mechanism had been quite well tested in the laboratory, and explained the little ice age being associated with the Maunder Minimum. So it's clear that we had a change in the direction of our temperature trend as of about 1998. Here's what I found on sun spot numbers... 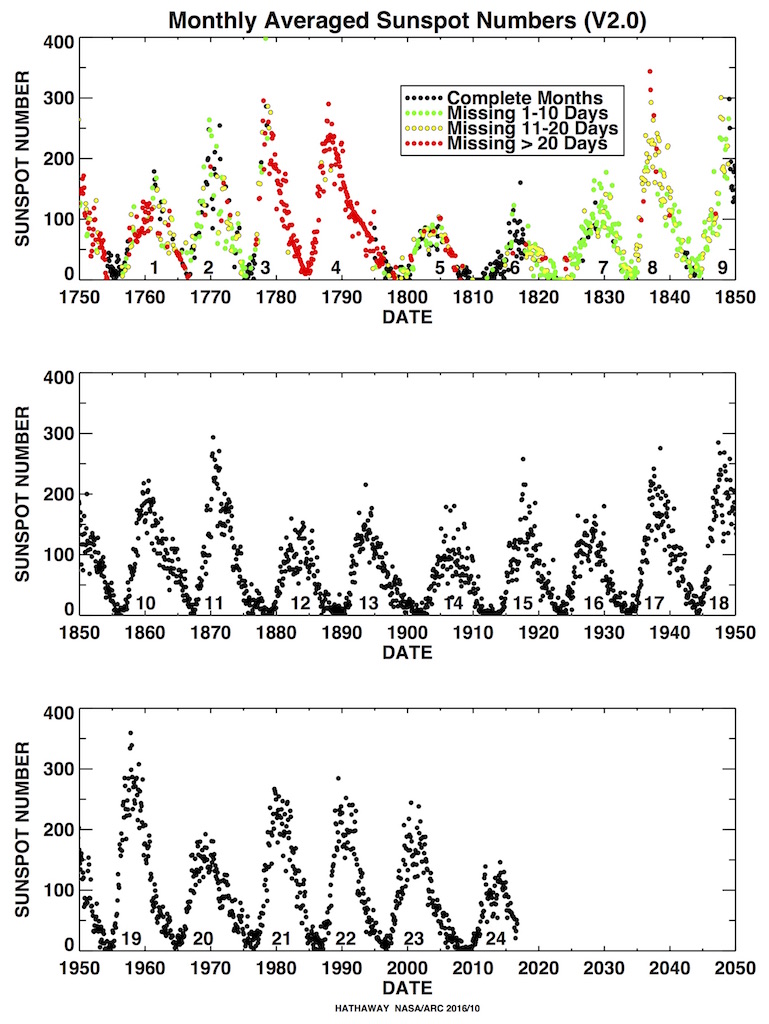 Well there is little doubt that this past solar cycle has been a weak one. Good support for the theory, right? Well it seems the alarmists have the answer. Adjust the sunspot data and get rid of the Maunder Minimum. Well that blows that theory all to hell! You can't make this stuff up folks! Corrected sunspot history suggests climate change not due to natural solar trends No doubt this will be accepted as scientific fact with little scrutiny, just like the Mann hockey stick graph was, even long after it was proven fraudulent. Oh, what to believe? | ||
Ducbsa |
Climate Corruption http://www.americanthinker.com/blog/2015/12/climat e_corruption.html | ||
Sifo |
Interesting graph comparison here.  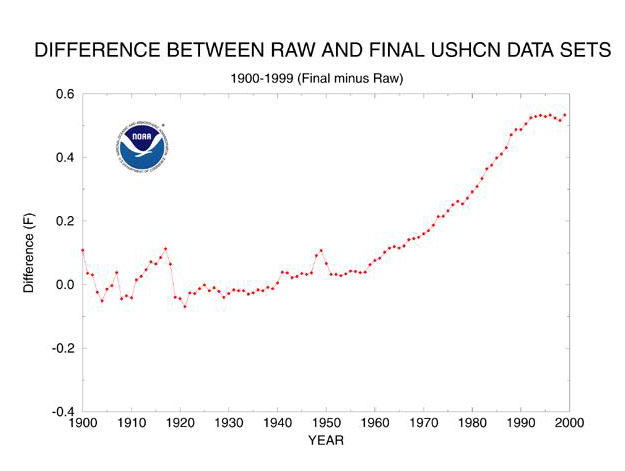 Sure looks like correlation. Yes, the second chart has to do with global temperature... Sort of. The second chart is graphing the "adjustments" that have been done to the raw data. Here's a chart that shows the various adjustment components. 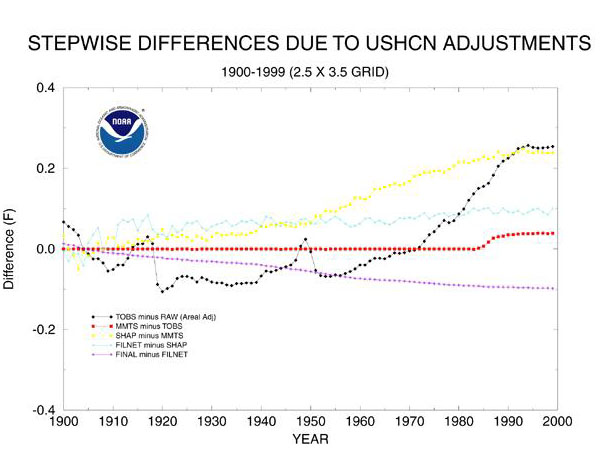 And the description of the legend for that chart...
Should we be the least bit suspicious that the only adjustment that adjusts downward have been removed? It's also the only adjustment not related to instrument issues. Is it really reasonable to believe that scientific instrumentation is getting less accurate/reliable and those issues stack up into such a one sided group of anomalies? It stretches the imagination. Here's the article... http://jennifermarohasy.com/2009/06/how-the-us-temperature-record-is-adjusted/ | ||
Aesquire |
http://wattsupwiththat.com/2015/12/05/the-ozone-sc are-was-a-dry-run-for-the-global-warming-scare/ They lied to you about ozone. But not until the patent ran out on Freon and they were making it in Mexico without paying the major chemical company. They lie to you about temperature. Follow the money. If they could make you pay they'd lie about radioactive dust falling from space. ( tons every day ) | ||
Aesquire |
http://quillette.com/2015/12/04/rebellious-scienti st-surprising-truth-about-stereotypes/ | ||
Sifo |
 |